PVGIS is an online free solar photovoltaic energy calculator for stand alone or connected to the grid PV systems and plants, in Europe, Africa, America and Asia. Solar electricity generator simulation and solar radiations maps
It gives the annual output power of solar photovoltaic panels.
As a photovoltaic Geographical Information System it proposes a googlemap application that makes it easy to use.
The area covered by the calculator is almost the world : America, Europe, Asia and Africa.
This application calculates the monthly and yearly potential electricity generation E [kWh] of a Photovoltaic system with defined modules tilt and orientation.
If you select the menu GRID CONNECTED, you get a calculator for fixed solar panels. With the menu TRACKING PV, PVgis compute the electricity generated by 1-axe or 2-axes solar PV trackers.
All data and results of simulations can be downloaded for free in CSV (Excel), pdf or viewed in html files. Note that PVgis is only available online, in english, italian, french, spanish and german.
Pvgis is a free solar PV energy calculator implemented by the JRC (Joint Reseach Center) from the European Commission's in-house science services.
PVGIS can't be downloaded. To download free softwares you can go to this section : Free Photovoltaic software to download or Softwares and tools from inverter manufacturers
NEW : Now PVgis covers also America, South and north (USA, Brasil, Colombia, Peru, Mexico...) and asia (China, India, Indonesia, Russia...)
Link to PVgis photovoltaic worlwide simulator:
PVGIS for Europe, america, asia and Africa

How to use PVGIS?
For systems connected to the grid :
PVGIS for PV grid-tied systems almost anywhere in the world (America, Asia, Africa and Europe)
Via the Google map it is possible to calculate the solar energy generation for a Grid tied PV system.Select the "Grid-tied" menu to get the PERFORMANCE OF GRID-CONNECTED PV CALCULATOR.
After choosing your place on the map you have to enter :
- Solar radiation database :The solar radiation data used in PVGIS have mostly been calculated from satellite data. In this way they have data for any location over large geographical areas with hourly time resolution. At the moment there are three different satellite-based databases available.
- PV Technology : Choose the type of solar panels you have. Note that main solar panels are fitted with crystalline silicon cells (monocristallin or polycristallin). You can choose among crystalline silicon cells, thin film modules made from CIS or CIGS, or thin film modules made from Cadmium Telluride (CdTe).
- Installed peak PV power [Wp] : Peak power of your photovoltaic panels, This is the power that the manufacturer declares that the PV array can produce under standard test conditions, which are a constant 1000W of solar irradiation per square meter in the plane of the array, at an array temperature of 25°C.
- System losses [%] : The estimated system losses are all the losses in the system, which cause the power actually delivered to the electricity grid to be lower than the power produced by the PV modules. There are several causes for this loss, such as losses in cables, power inverters, dirt (sometimes snow) on the modules and so on. Over the years the modules also tend to lose a bit of their power, so the average yearly output over the lifetime of the system will be a few percent lower than the output in the first years. The default value is 14%, you can keep this value for a first estimation. If you have a good idea that your value will be different (maybe due to a really high-efficiency inverter) you may reduce this value a little. You can also increse it if you think that you have more losses like losses due to near shadings (buidings, tress,...) .
- Mounting position : Select the way your solar panels are mounted.
- Slope [°] :This is the angle between horizontal and surface of the panel, o° is for horizontal, 90° is for vertical.
- Azimuth [°] :The azimuth, or orientation, is the angle of the PV modules relative to the direction due South. -90° is East, 0° is South and 90° is West..
- PV system cost (your currency) : Here you should input the total cost of installing the PV system, including PV system components (PV modules, mounting, inverters, cables etc.) and installation costs (planning, installation....). The choice of currency is up to you, the electricity price calculated by PVGIS will then be the price per kWh of electricity in the same currency you used.
- Interest [%/year] : This is the interest rate you pay on any loans needed to finance the PV system. This assumes a fixed interest rate on the loan which will be paid back in yearly installments for the lifetime of the system.
- Lifetime [years]* :This is the expected lifetime of the PV system in years. This is used to calculate the effective electricity cost for the system. If the PV system happens to last longer the electricity cost will be correspondingly lower
- Solar radiation database :The solar radiation data used in PVGIS have mostly been calculated from satellite data. In this way we have data for any location over large geographical areas with hourly time resolution. At the moment there are three different satellite-based databases available.
- Installed peak PV power [Wp] : Peak power of your photovoltaic panels, This is the power that the manufacturer declares that the PV array can produce under standard test conditions, which are a constant 1000W of solar irradiation per square meter in the plane of the array, at an array temperature of 25°C.
- Battery capacity [Wh] : This is the size, or energy capacity, of the battery used in the off-grid system, measured in watt-hours (Wh). If instead you know the battery voltage (say, 12V) and the battery capacity in Ah, the energy capacity can be calculated as Energy capacity=voltage*capacity. The capacity should be the nominal capacity from fully charged to fully discharged, even if the system is set up to disconnect the battery before fully discharged (see next option).
- Discharge cutoff limit [%] : Batteries, especially Lead-acid batteries, degrade quickly if they are allowed to completely discharge too often. Therefore a cutoff is normally imposed, so that the battery charge cannot go below a certain percentage of full charge. This should be entered here. The default value is 40%.
- Consumption per day [Wh] :This is the energy consumption of all the electrical equipment connected to the system during a 24 hour period. PVGIS assumes that this daily consumption is distributed in a way over the hours of the day, corresponding to a typical home use with most of the consumption during evening. The hourly fraction of consumption assumed by PVGIS is found here.
Financial analysis : PV electricity price
Note that PVgis can include the terrain shadows and it offers 2 options :
- Use the calculated horizon from PVGIS (you can even download the remote horizon data of the location. Nearest shadings due to buildings or trees is not included.
- Upload horizon file, if yu have your own horizon dataset.
RESULTS
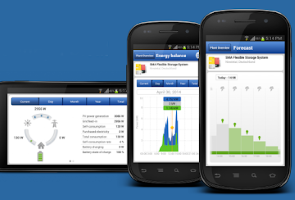
Then you will get graphs and tables that show the (estimated) daily amount of electric power you can expect in each month from a Solar Home PV system with the properties you entered (using optimal inclination, if you requested so). It also shows the yearly average production per day and gives statistics data.For OFF-GRID systems :
PVGIS for PV remote systems, not connected to the grid, almost anywhere in the world (America, Asia, Africa and Europe)
Via the Google map it is possible to calculate the solar energy generation for a stand-alone PV system. This is useful to get a good assessment of the energy power required to match your electrical needs in remote area not connected to the grid. Select the "Off Grid" menu to get the PERFORMANCE OF OFF-GRID PV SYSTEMS CALCULATOR.
After choosing your place on the map you have to enter :
Slope/Inclination of modules : slope of your solar panels
Azimuth/Orientation of modules : Orientation (azimut or direction) of your solar panels, the best is the south for the northern hemisphere, the north for the southern
Then you will get graphs and tables that show the (estimated) daily amount of electric power you can expect in each month from a Solar Home PV system with the properties you entered (using optimal inclination, if you requested so). It also shows the yearly average production per day and gives statistics data such as the number of days corresponding to a state of charge or discharge of battery.
Note that PVgis can include the terrain shadows and it offers 2 options :
- Use the calculated horizon from PVGIS (you can even download the remote horizon data of the location. Nearest shadings due to buildings or trees is not included.
- Upload horizon file, if yu have your own horizon dataset.
PVGIS : Solar radiation Database
If you select the menu MONTHLY DATA or DAYLY DATA or HOURLY DATA, you will get the relevant radiation data for the selected location.PVGIS provide a large and accurate solar radiation free database for europe, Africa Mediterranean Basin and South-West Asia : solar radiation interactive maps.
Furthermore it is possible to dowload for free maps of radiation for different countries and regions :
Europe, Europe Mediterranean region, Europe Alpine region, Albania Austria, Bosnia and Herzegovina, Belgium, Bulgaria, Belarus, Switzerland, Cyprus, Czech Republic, Germany, Denmark, Estonia, Finland, France, United Kingdom, Greece, Croatia, Hungary, Ireland, Island, Italy, Lithuania, Luxembourg, Latvia, Malta, Moldavia, FYR Macedonia, Montenegro, Netherlands, Norway, Poland, Portugal Romania, Serbia, Spain, Sweden, Slovakia, Slovenia, Turkey, Ucraine,
Africa :
Algeria
Angola
Benin
Botswana
Burkina Faso
Burundi
Cameroon
Cape Verde
Central African Republic
Chad
Comores
Congo, Democratic Republic of
Congo, Republic of the
Djibouti
Egypt
Equatorial Guinea
Eritrea
Ethiopia
Gabon
Gambia
Ghana
Guinea
Guinea-Bissau
Ivory Coast
Kenya
Lesotho
Liberia
Libya
Madagascar
Malawi
Mali
Mauretania
Morocco
Mozambique
Namibia
Niger
Nigeria
Rwanda
Sao Tome and Principe
Senegal
Sierra Leone
Somalia
South Africa
South Sudan
Sudan
Swaziland
Tanzania
Togo
Tunisia
Uganda
Western Sahara
Zambia
Zimbabwe
Link to the posters and maps to download : PVGIS solar radiation maps for Europe and Africa.
See others worldwide solar radiations databases